

Data analysis and visualization have always been extremely important issues in the professional environment and a fundamental tool for decision-making in companies. In this environment, Microsoft Excel became easily popular and established itself as one of the main data manipulation tools in the market, however, with the advance of Big Data, the exponential growth of data in the world and the growth of the culture of Analytics and Data Science o Excel is no longer such an efficient tool.
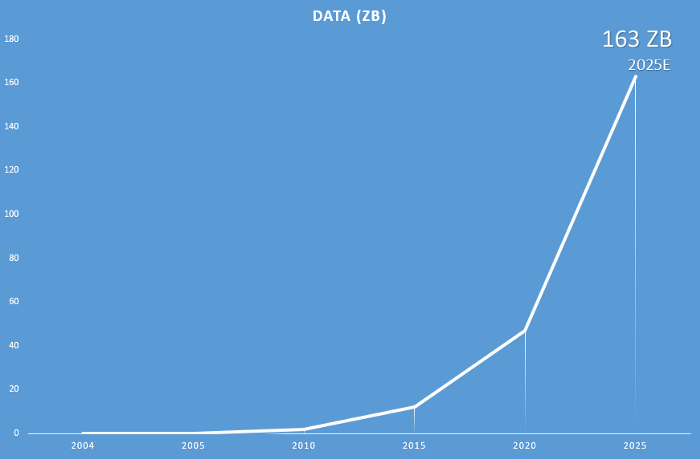
The amount of data in the world is growing by 40% each year and could reach around 163 Zettabytes by 2025.
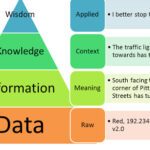
“Data is the new gold!”
Year after year, companies focus more on data and how to take value from it to sell more products, get more customers, increase the efficiency of the process, etc. In this scenario, a tool that deals with this large amount of data and is able to expose information becomes essential. To address this necessity Microsoft created Power BI, a visualization tool that is capable to handle Big Data and at the same time change the way that we interact with charts.
Excel vs Power BI for Visualization
We know that Excel has excellent features and allows the user to work in a simple and effective way with data manipulation, in addition to being a tool already known in the market, but even so, the program leaves something to be desired. When we need to manipulate a large number of data, for example, excel crashes a lot in the visualization, presents some interface bugs, does not load the entire file, and can cause serious problems such as file corruption. Another case is when we have a need to do complex graphical analysis or create dashboards, in Excel it is not simple to organize the graphs, the design is not so attractive and you cannot work with dynamic and interconnected graphs. In these cases, Power BI proves to be extremely useful and with a huge advantage over Excel, making data manipulation more agile and efficient.
With a wide range of graphics and widgets, a good ability to deal with big data, integration with different platforms and ease of use, a centralization of different data sources, Power BI has been showing itself increasingly strong in the market.
Below are some comparison data between the two tools:
Data Volume
Power BI is prepared for Big Data and can handle 2000x more data than Excel.
- Excel — 1,048,576 (1 million), but it starts giving problems with 500 thousand lines
- Power BI — 1,999,999,997 (2 billion), optimized to not show all lines at once
Charts and Visuals
Power BI has interactive visuals with dynamic filtering in real-time, highly customizable, a marketplace that you can find and download visuals, and new visuals that you can develop by yourself and import them.
- Excel — It presents the option to activate new types of graphs but the way to create and print the graphs is not so simple and it has no dynamic interaction between graphs.
- Power BI — Possibility of interaction between graphics in real-time, dynamic graphics, creation of new graphics using typescript, easy import of new graphics through the Marketplace or direct importing
Integration with external data
Power BI can handle multiple data sources like cloud databases, SQL servers, and more.
- Excel — Read data from an Excel Spreadsheet or CSV
- Power BI — Databases (Azure SQL, Spark, Oracle, etc.), Content Packages (google analytics, GitHub, etc.), Files (Excel spreadsheets, CSV, text, etc.), and more types of data
In summary, Power BI enables the creation of highly customizable dashboards that are easy to create and manipulate, real-time interaction between charts for a more dynamic data analysis, features that optimize insights and generate great reports, tools for developing ETLs and data pipelines, and more.
First steps
Okay, now you must be wondering, how do I use this Power BI?
Power BI has two ways to access data and use the service, the Power BI Service that you access directly from your browser and the Power BI Desktop that you can download on your Windows and use locally.
At first, I will demonstrate the Power BI Service:
The home page will appear and you can click on Sign in to use your Microsoft account, or create a new one if you want to use it for free. The development tool is very similar to the Power BI desktop.
For Power BI Desktop I will present a quick tutorial on how you can start to use it. To download the Power BI desktop on your windows computer you have to open this link below:
https://www.microsoft.com/en-us/download/details.aspx?id=58494
After download and install you can start to create your dashboards using the first steps presented below:
Importing data
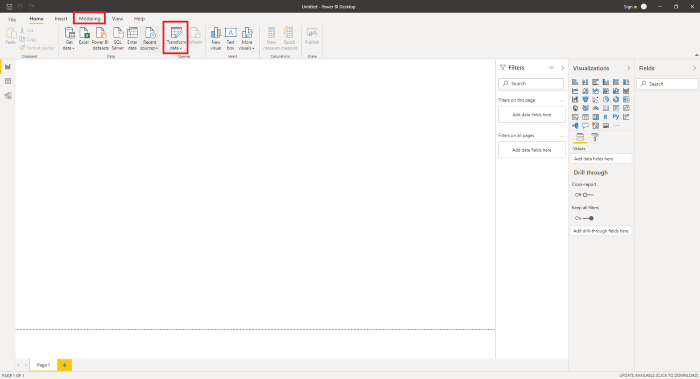
As soon as you start PowerBI the main screen like the screenshot below will be displayed. You can click on “Get Data” to see all kinds of data that Power BI can import or select one of the types of data presented in the menu like Excel, Power BI datasets, SQL server, and others.
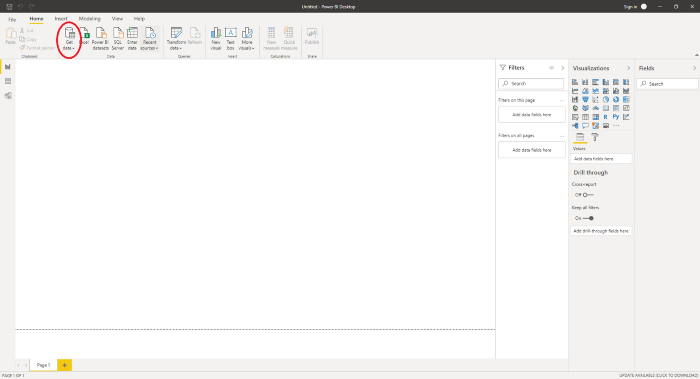
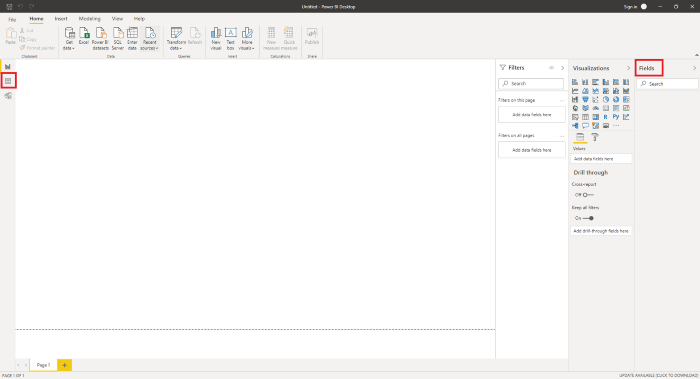
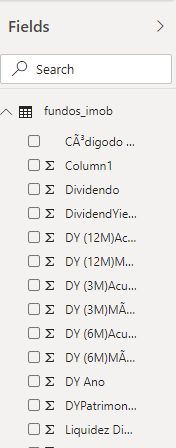
The files you add will be presented in a Table format in the right side menu called “Fields” or in the left side menu in a tab called “Data”.
Editing the data
After import your data you can edit and create some transformations pipelines using the tool “Transform data” or some calculations with the tab “Modeling”
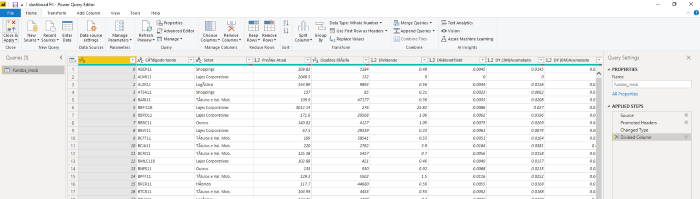
The “Transform Data” tool, known as Power Query editor has a lot of good tools for you to edit and transform your data. You can have more information about how to use it in the link below and you can a screenshot of the Power Query editor in the image as well.
https://docs.microsoft.com/en-us/power-bi/transform-model/
Developing dashboards
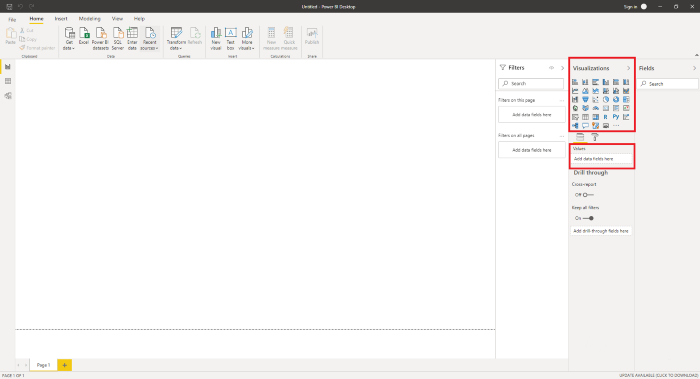
In the right side menu, you will have access to the “Visualizations” pane which is where you will choose the type of graph you will use and drag it to the work area easily with drag and drop. In the Fields menu, you can access the data in your file that you can drag to the graphs to generate visualizations.
Below is a quick demonstration showing a “Line and stacked column chart” with legend and filters. We have a graph of “DY(12M)” by Asset with a Sector legend segmentation together with a “P/VPA” line variation and a filter per “Asset code” and “DY(12M)” above chart.
Conclusion
Power BI is a great way to start exploring the field of Data Analytics and get valuable insights into a high-volume dataset. If you are familiar with Microsoft Excel you will have a huge advantage in the development, since many tools, charts, and formulas are very similar to Excel.
I hope it was a good read! For any feedback or questions related to Power BI and Data Analytics, feel free to contact me on LinkedIn: https://www.linkedin.com/in/octavio-b-santiago/
If you are interested in learning more about Power BI, I recommend the free Learning Path from Microsoft: https://docs.microsoft.com/en-us/learn/powerplatform/power-bi